About 40% of smartphone game users have experience of making payments.
< TOPICS >
- About 40% of smartphone game users have experience of making payments.
- Males are more likely to pay for smartphone games than females, and younger age groups are more likely to do it.
- Nearly 70% of those with experience of making payments communicate with other players in the game.
- More than half of them pay less than ¥1,000 per month.
- Users paying less than 500 yen a month have a strong sense of feeling “pathetic” about their behavior, and have a negative impression overall.
- About 40% of the payers feels they are busy playing the game itself.
Survey outline
| Research name | Survey on Smartphone Game Apps Payments |
|---|---|
| Target criteria | 【Gender】 Male and female 【Age】 20-59 【Area】 All Japan 【Occupation】 Employed (excluding part-time workers) 【Others】 Individuals with experience of payments for smartphone game apps in the past year. Individuals who pay smartphone bills on their own. Respondents with personal annual incomes. |
| Subjects | 【Screening】 ・Annual personal income. ・Monthly savings. ・Experience of playing game apps. ・Experience of paying for game apps. ・Payment source of smartphone bills. ・Amount of personal free time. ・Average duration of playing game apps. ・Level of communication with other players in game apps. 【Main survey】 ・Average monthly payment on smartphone games. ・Whether they wish to pay more or less. ・Feelings after payment. ・How they position themselves compared to other payment users. ・How busy they feel about smartphone games. ・Any hobbies other than gaming. |
| Sample size | 800 samples |
| Quota | Equal for age and gender Q3 (Feeling after payment) Positive-Negative inverted equality |
| Research period | August 3rd (Tuesday) to August 6th (Friday), 2021 |
| Research method | Web Survey |
| Research institution | ASMARQ Corporation |
Experience of playing game apps.
- Question
-
- SC4.Have you paid for any game apps on your smartphone over the past year? (Select one only)
What percentage of users have experience of making payments?
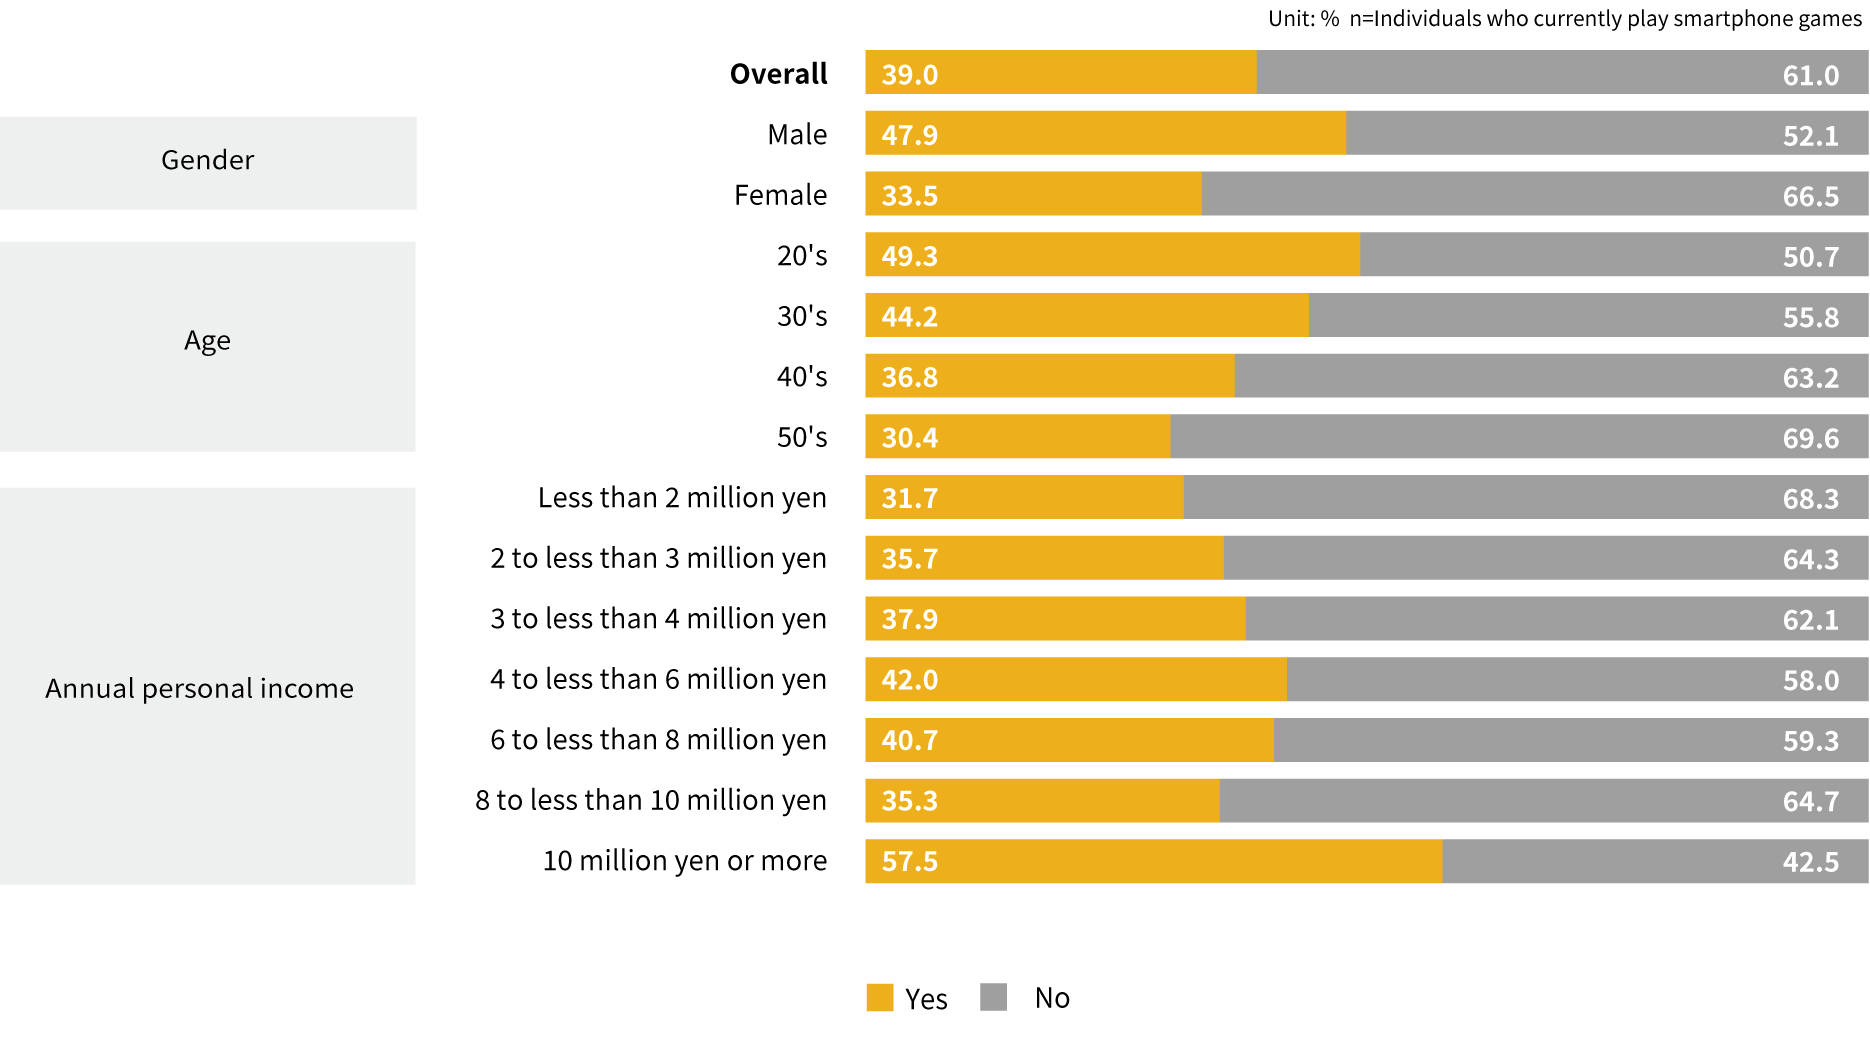
About 40% of smartphone game users have experience of making payments.
Males are more likely to pay for smartphone games than females, and younger age groups are more likely to do so.
More than half of users with personal annual incomes of 10 million yen or more have experience of making payments.
Average duration of playing game apps.
- Question
-
- SC7.How much time averagely do you spend playing game apps in a day? (Select one only)
What is the difference in playing times between users with experience of paying for game apps and users without such experience?
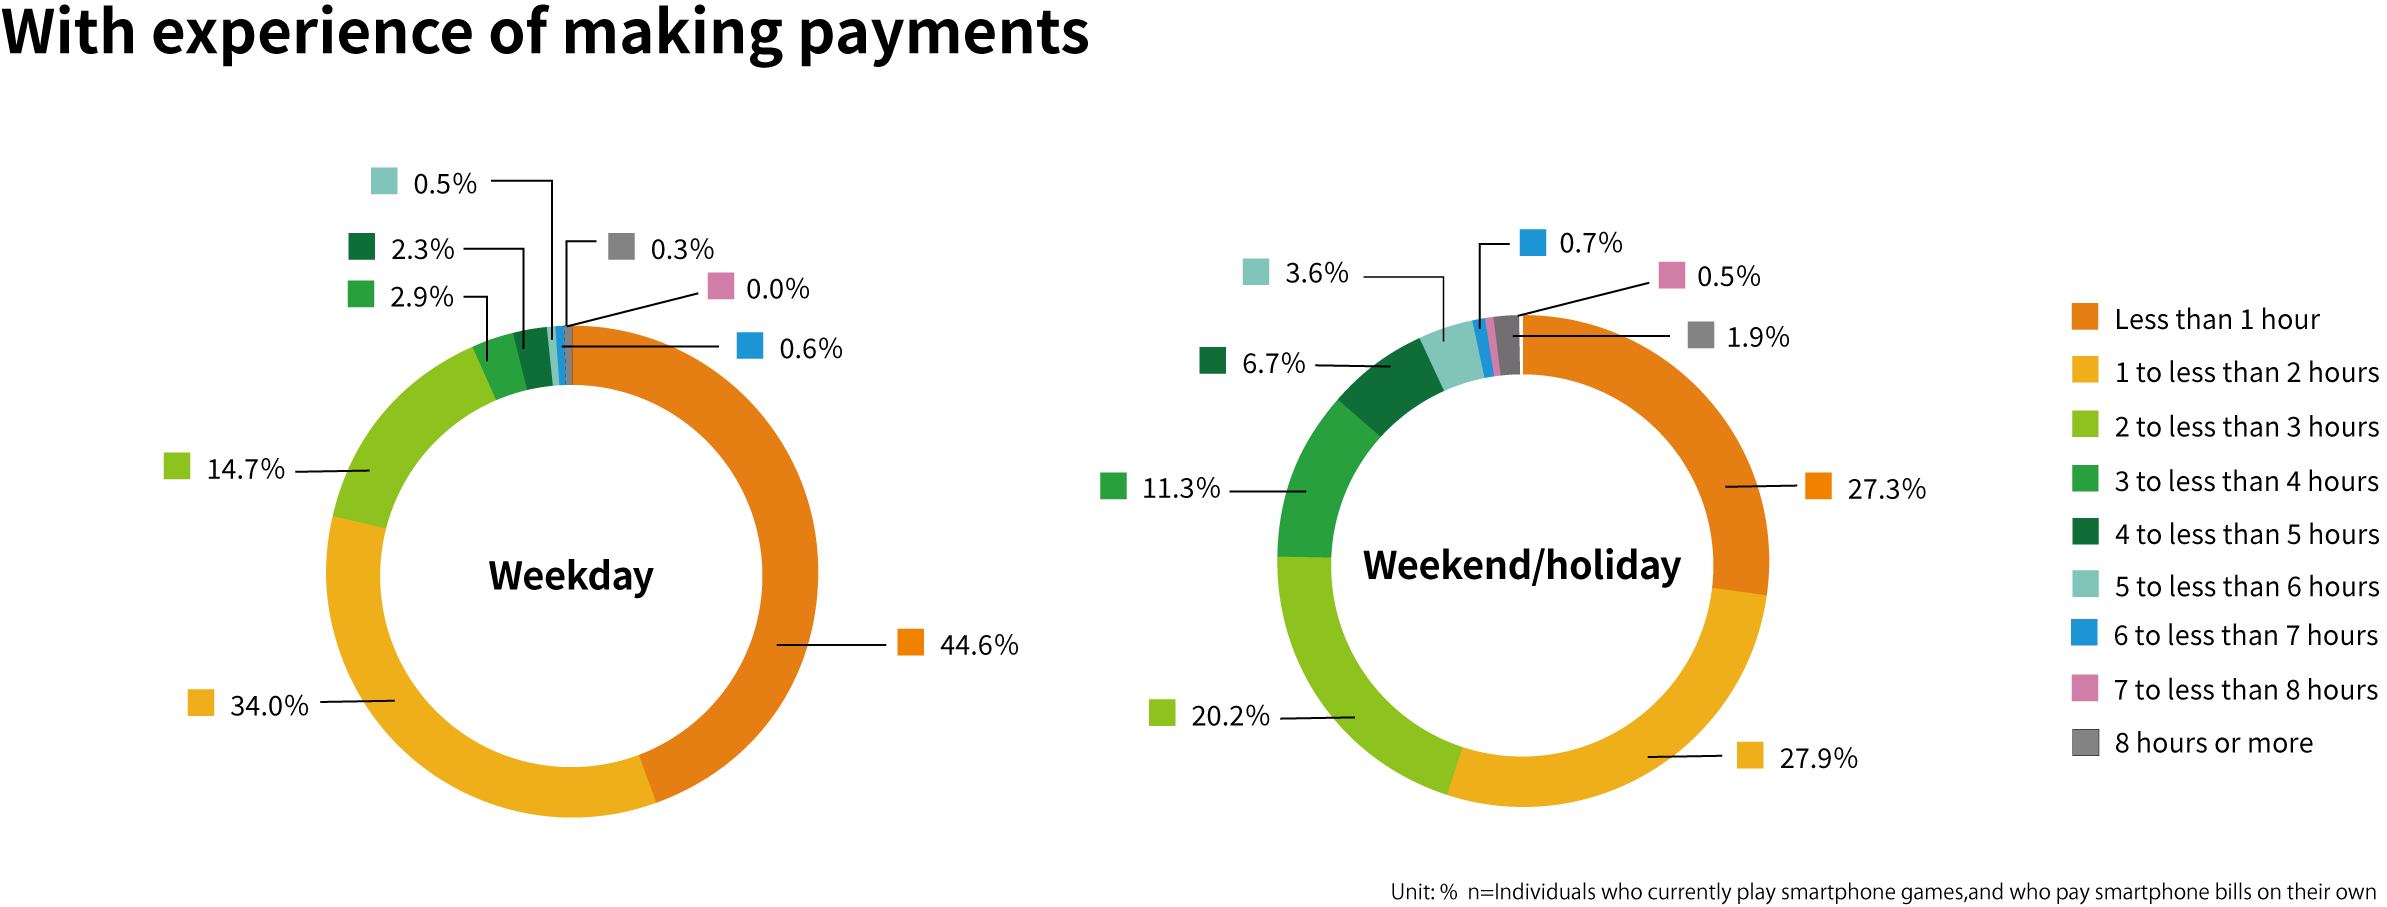
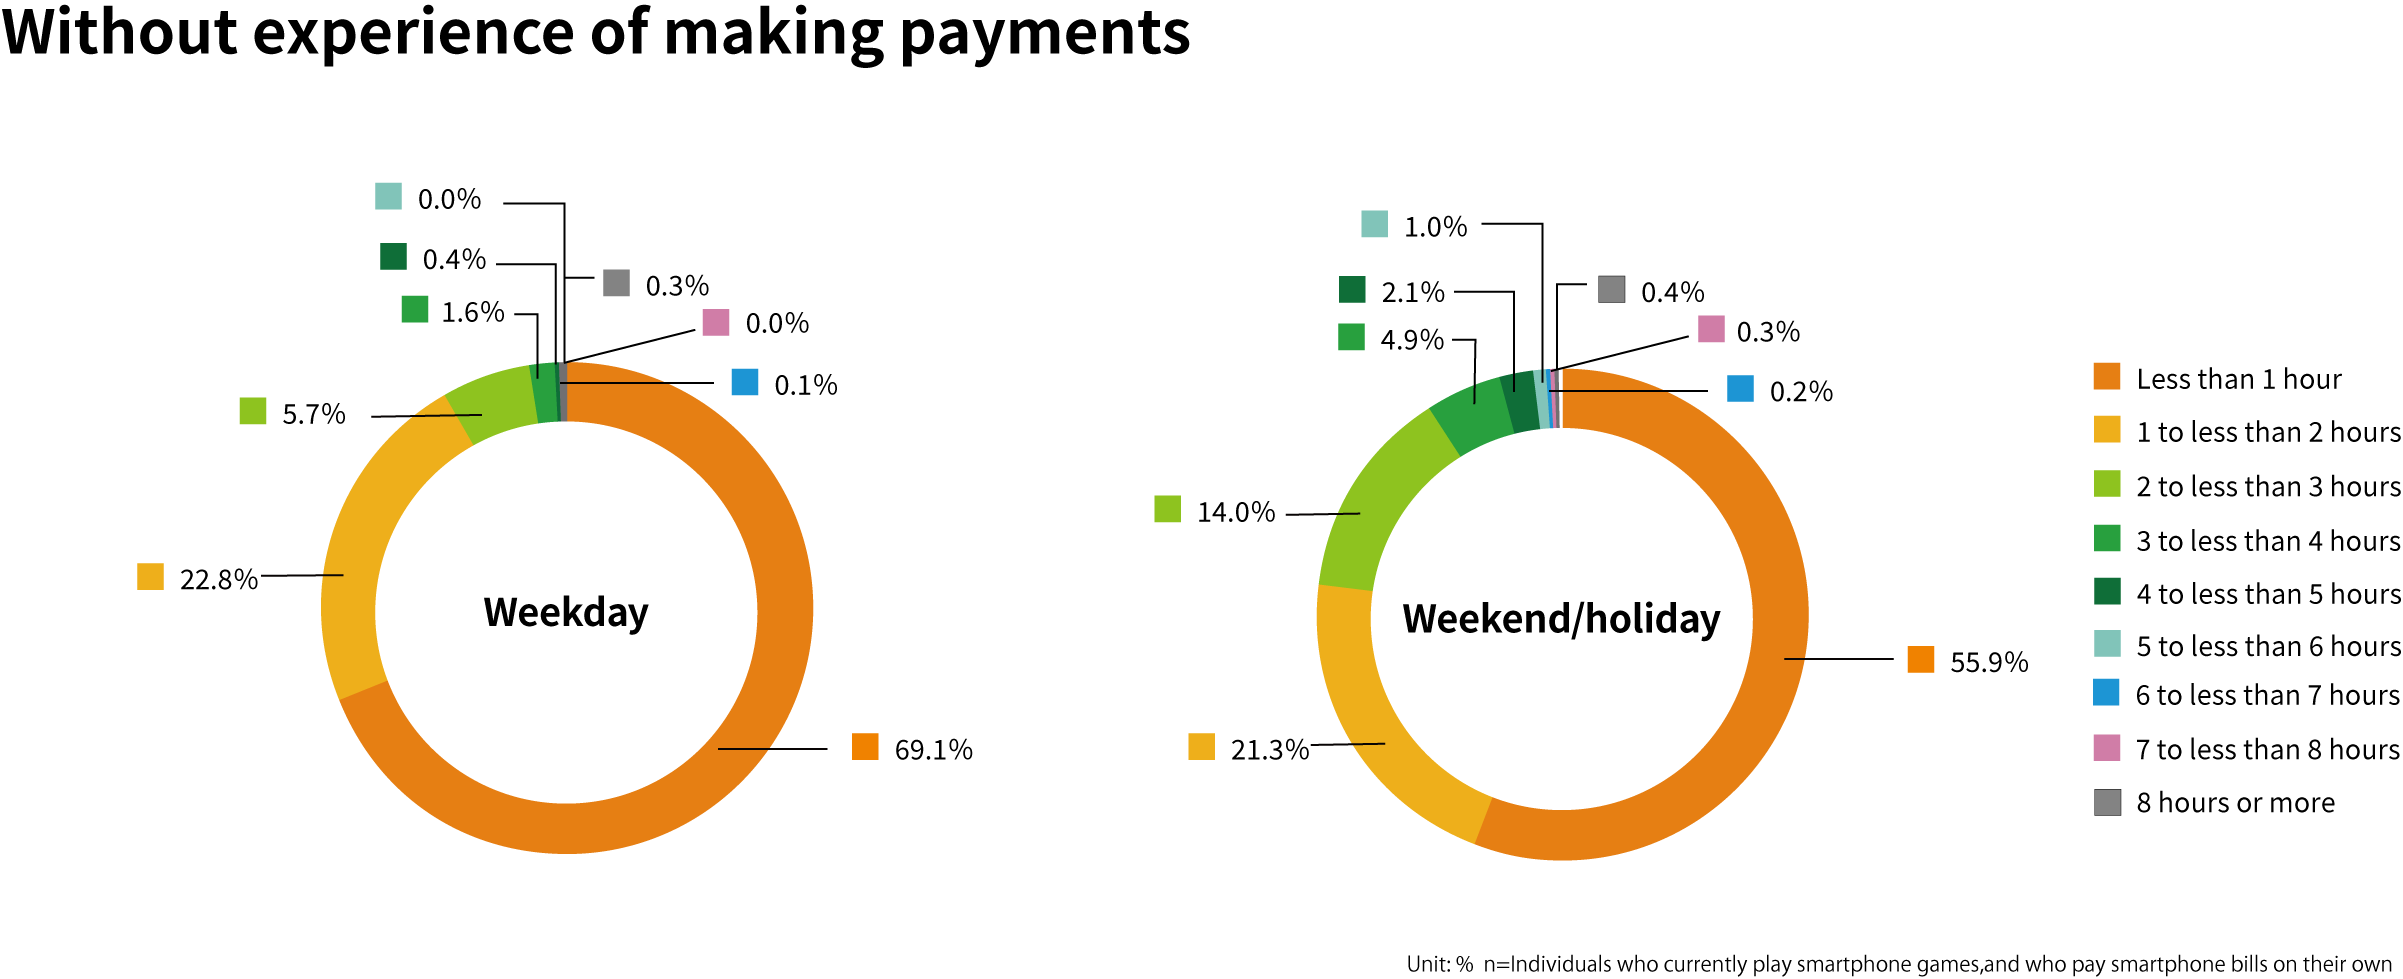
Users with experience of paying for games spend more time on games compared to those without such experience.
The time spent by users without experience of making payments doesn't differ so much between weekdays and holidays. But those with experience of making payments spend significantly longer playing games on weekends and holidays.
Level of communication with other players in game apps.
- Question
-
- SC8.How much communication do you have with other players in smartphone game apps? (Select one only)
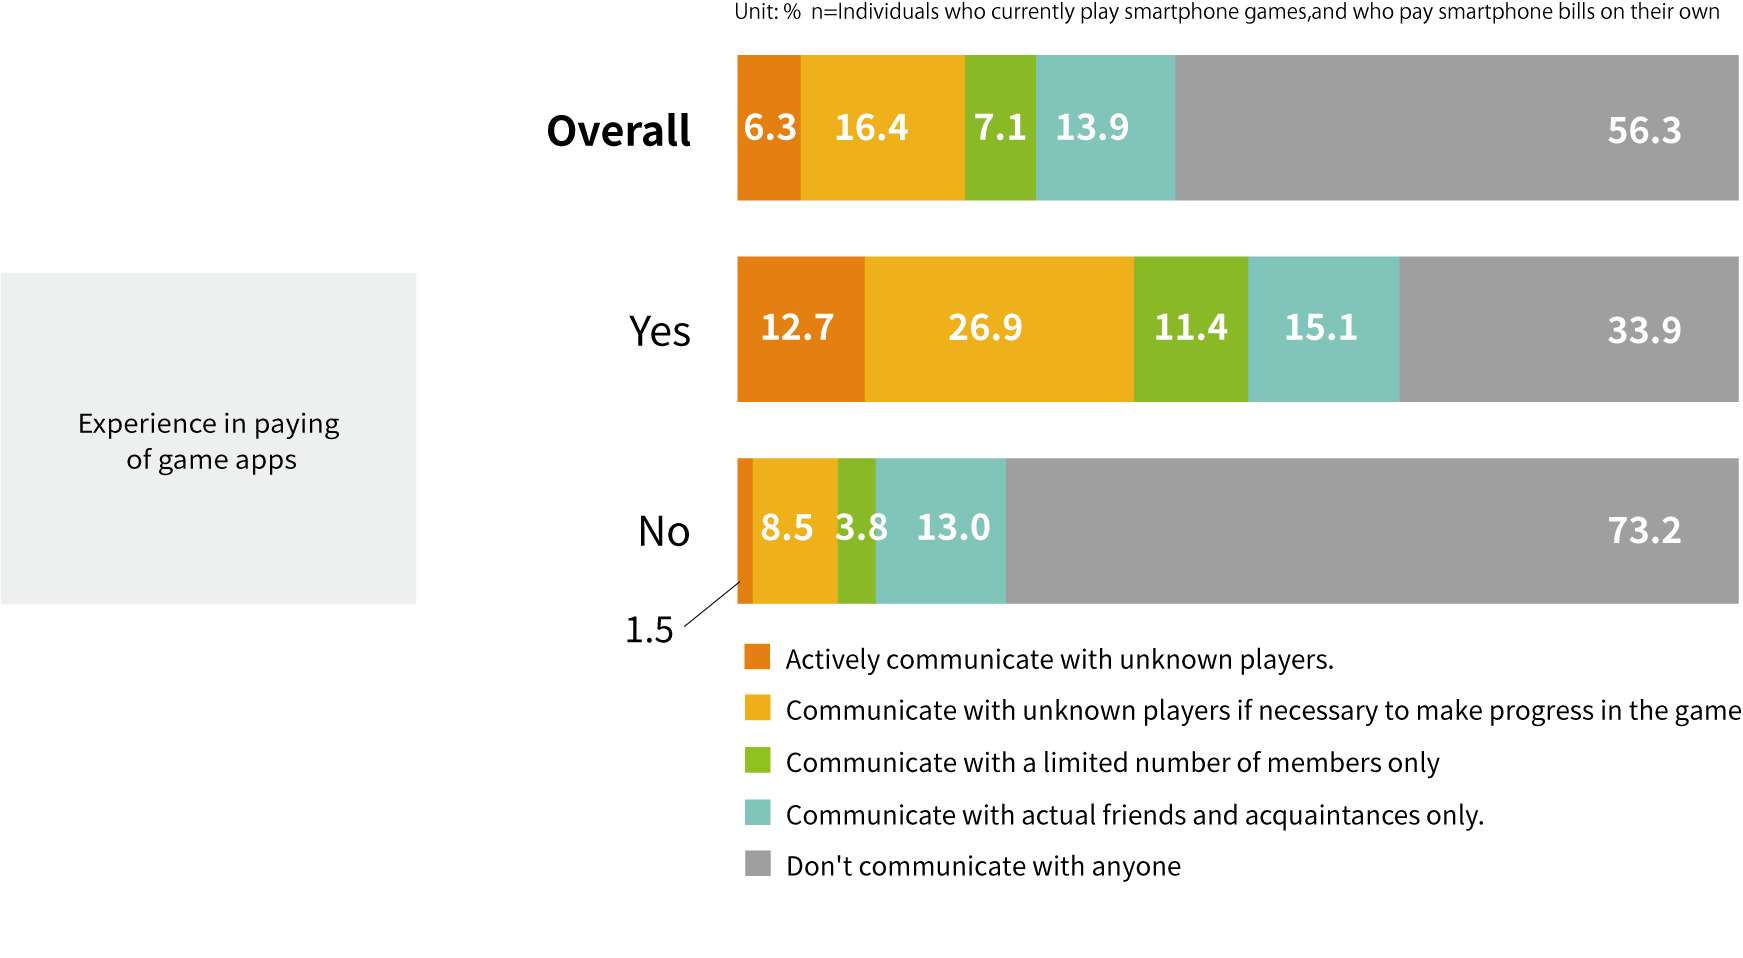
Is there any difference in the level of communication within the game between those with and without experience of making payments?
More than 70% of players without payment experience don't communicate with anyone in the game, while nearly 70% of players with payment experience do communicate with other players.
Average monthly payment on smartphone games.
- Question
-
- Q1.What is the average amount you pay per month for smartphone games? (Select one only)
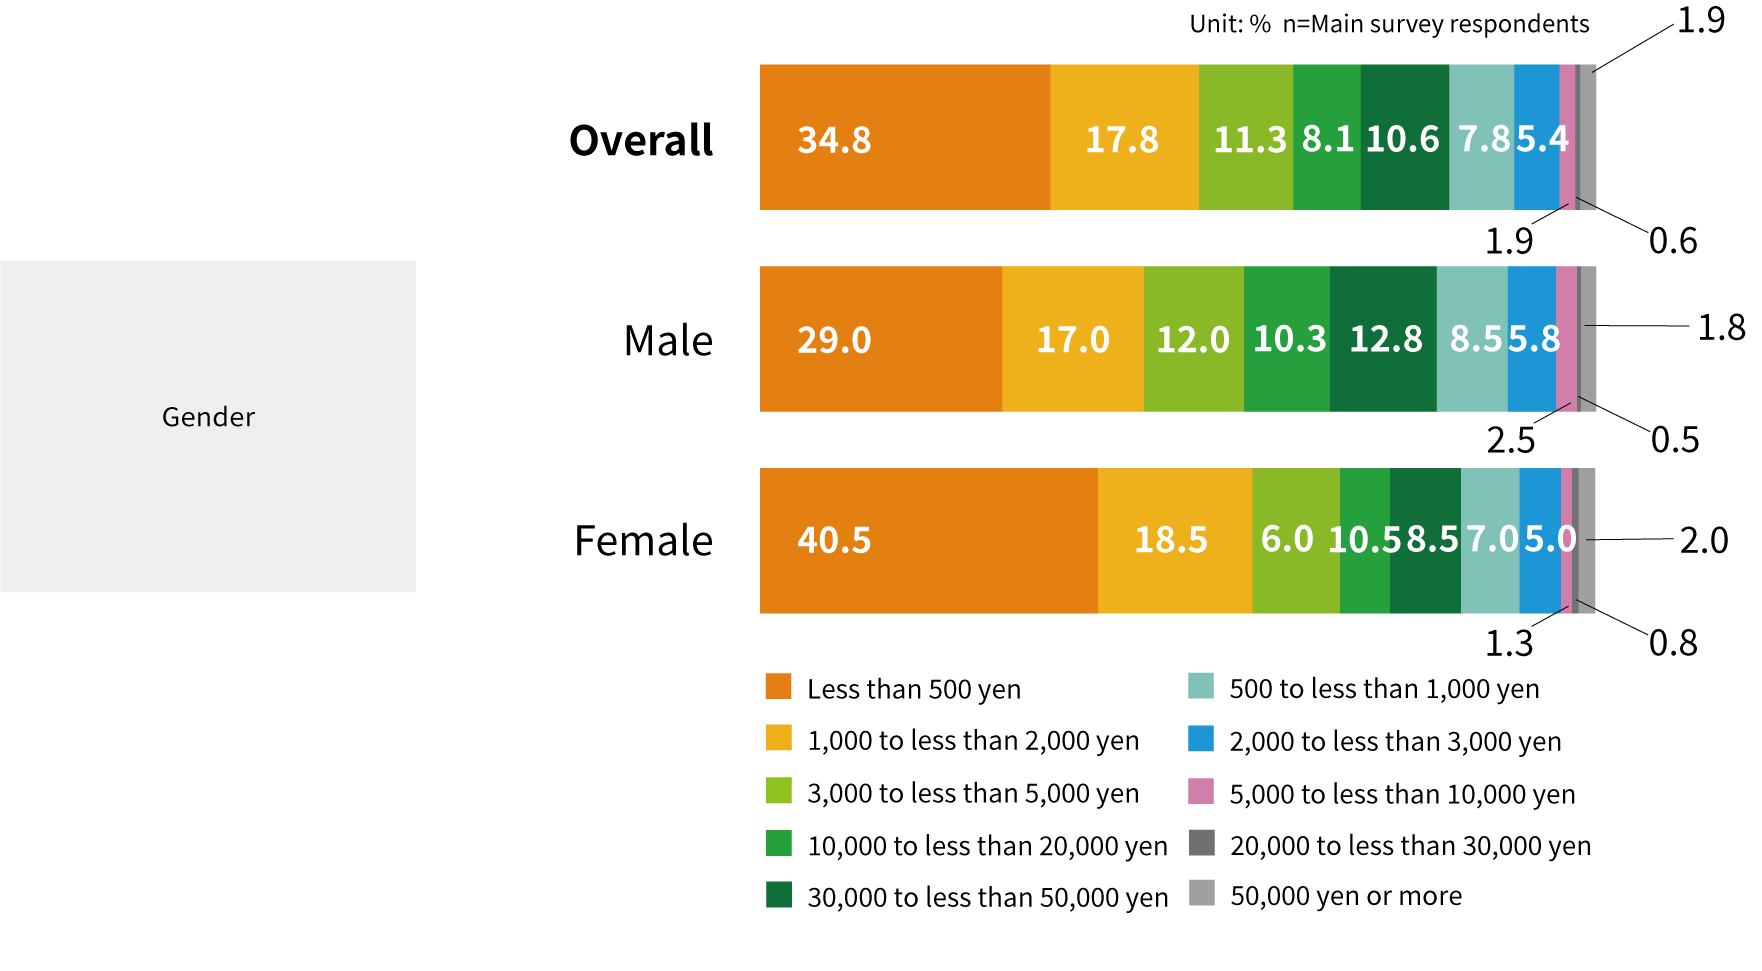
How much is the average monthly payment amount?
More than half of the respondents pay less than 1,000 yen per month.
About 30% of men and 40% of women spend less than 500 yen.
Whether they wish to pay more or less.
- Question
-
- Q2.What applies to your feelings about the amount you pay for smartphone games? (Select one only)
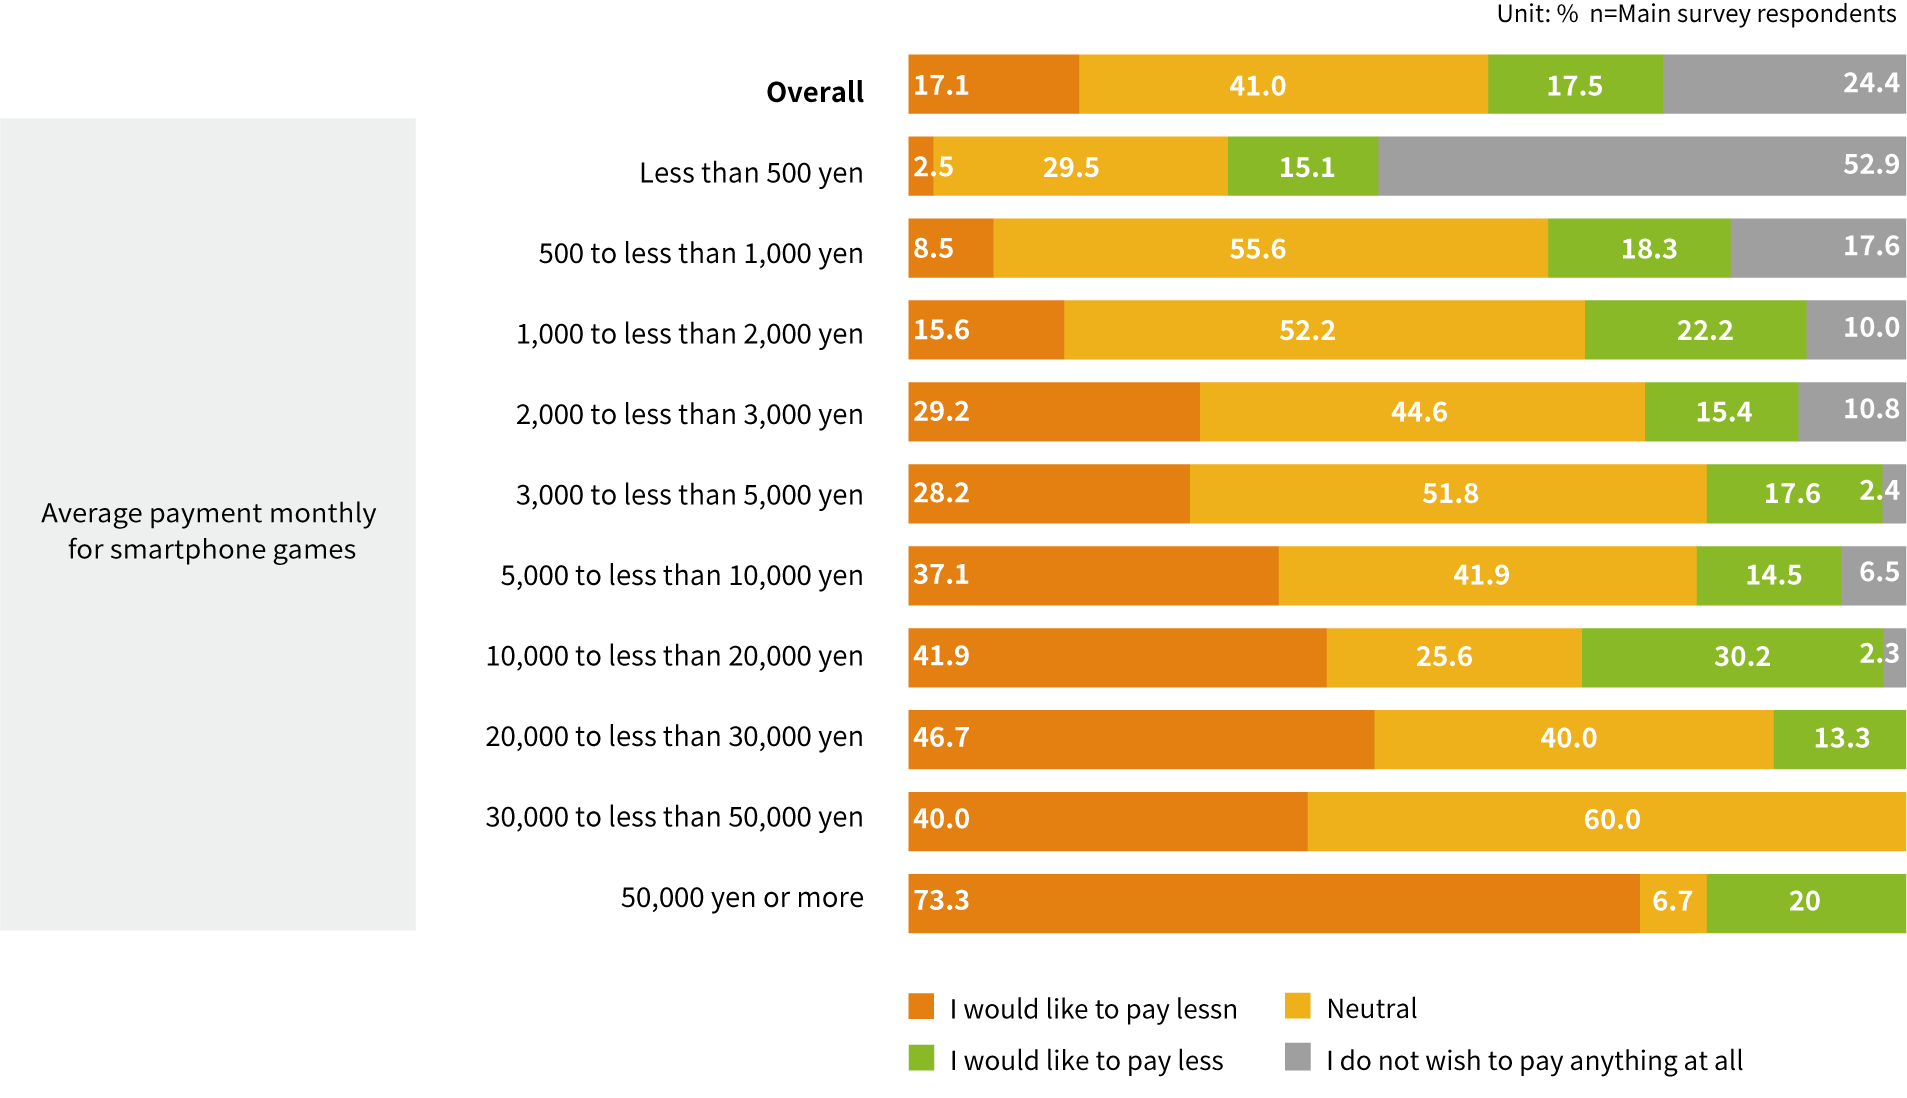
Do those who make payments want to increase or decrease the amount of their payments?
More than half of users paying less than 500 yen a month answered that they don't want to pay at all. However, those making larger monthly payments were inclined to pay more.
Feelings after payment
- Question
-
- Q3.Please tell us how you feel after paying for a smartphone game. (Select one only)
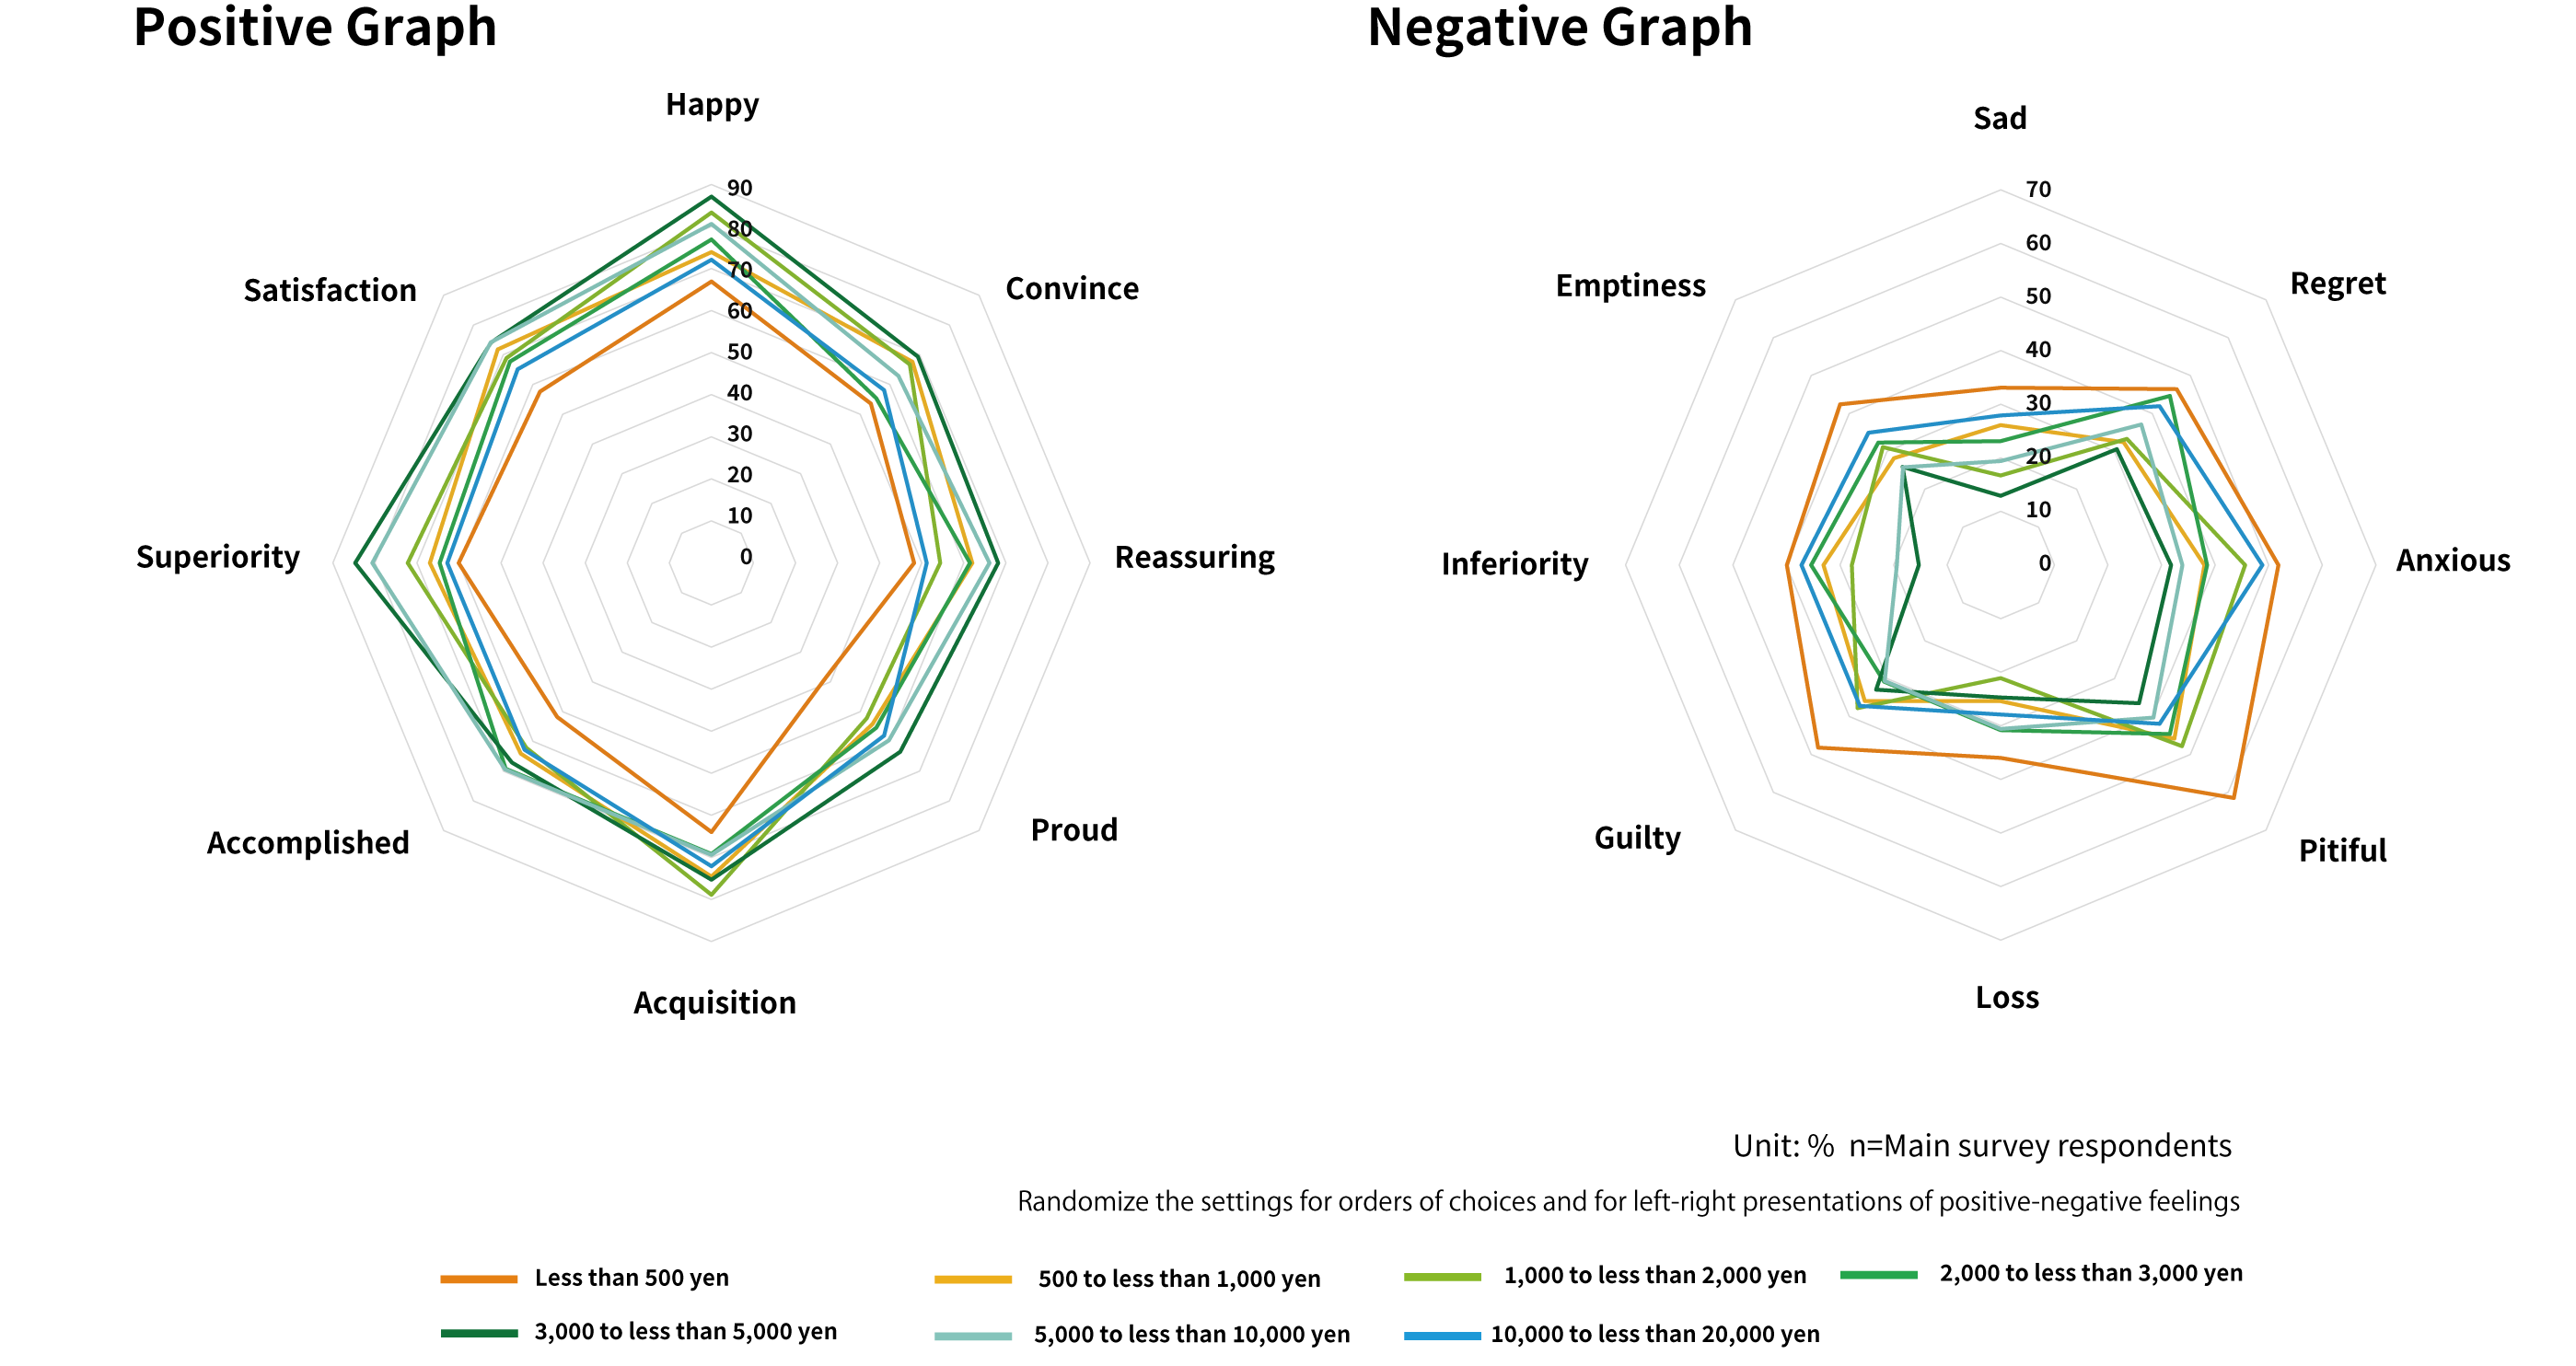
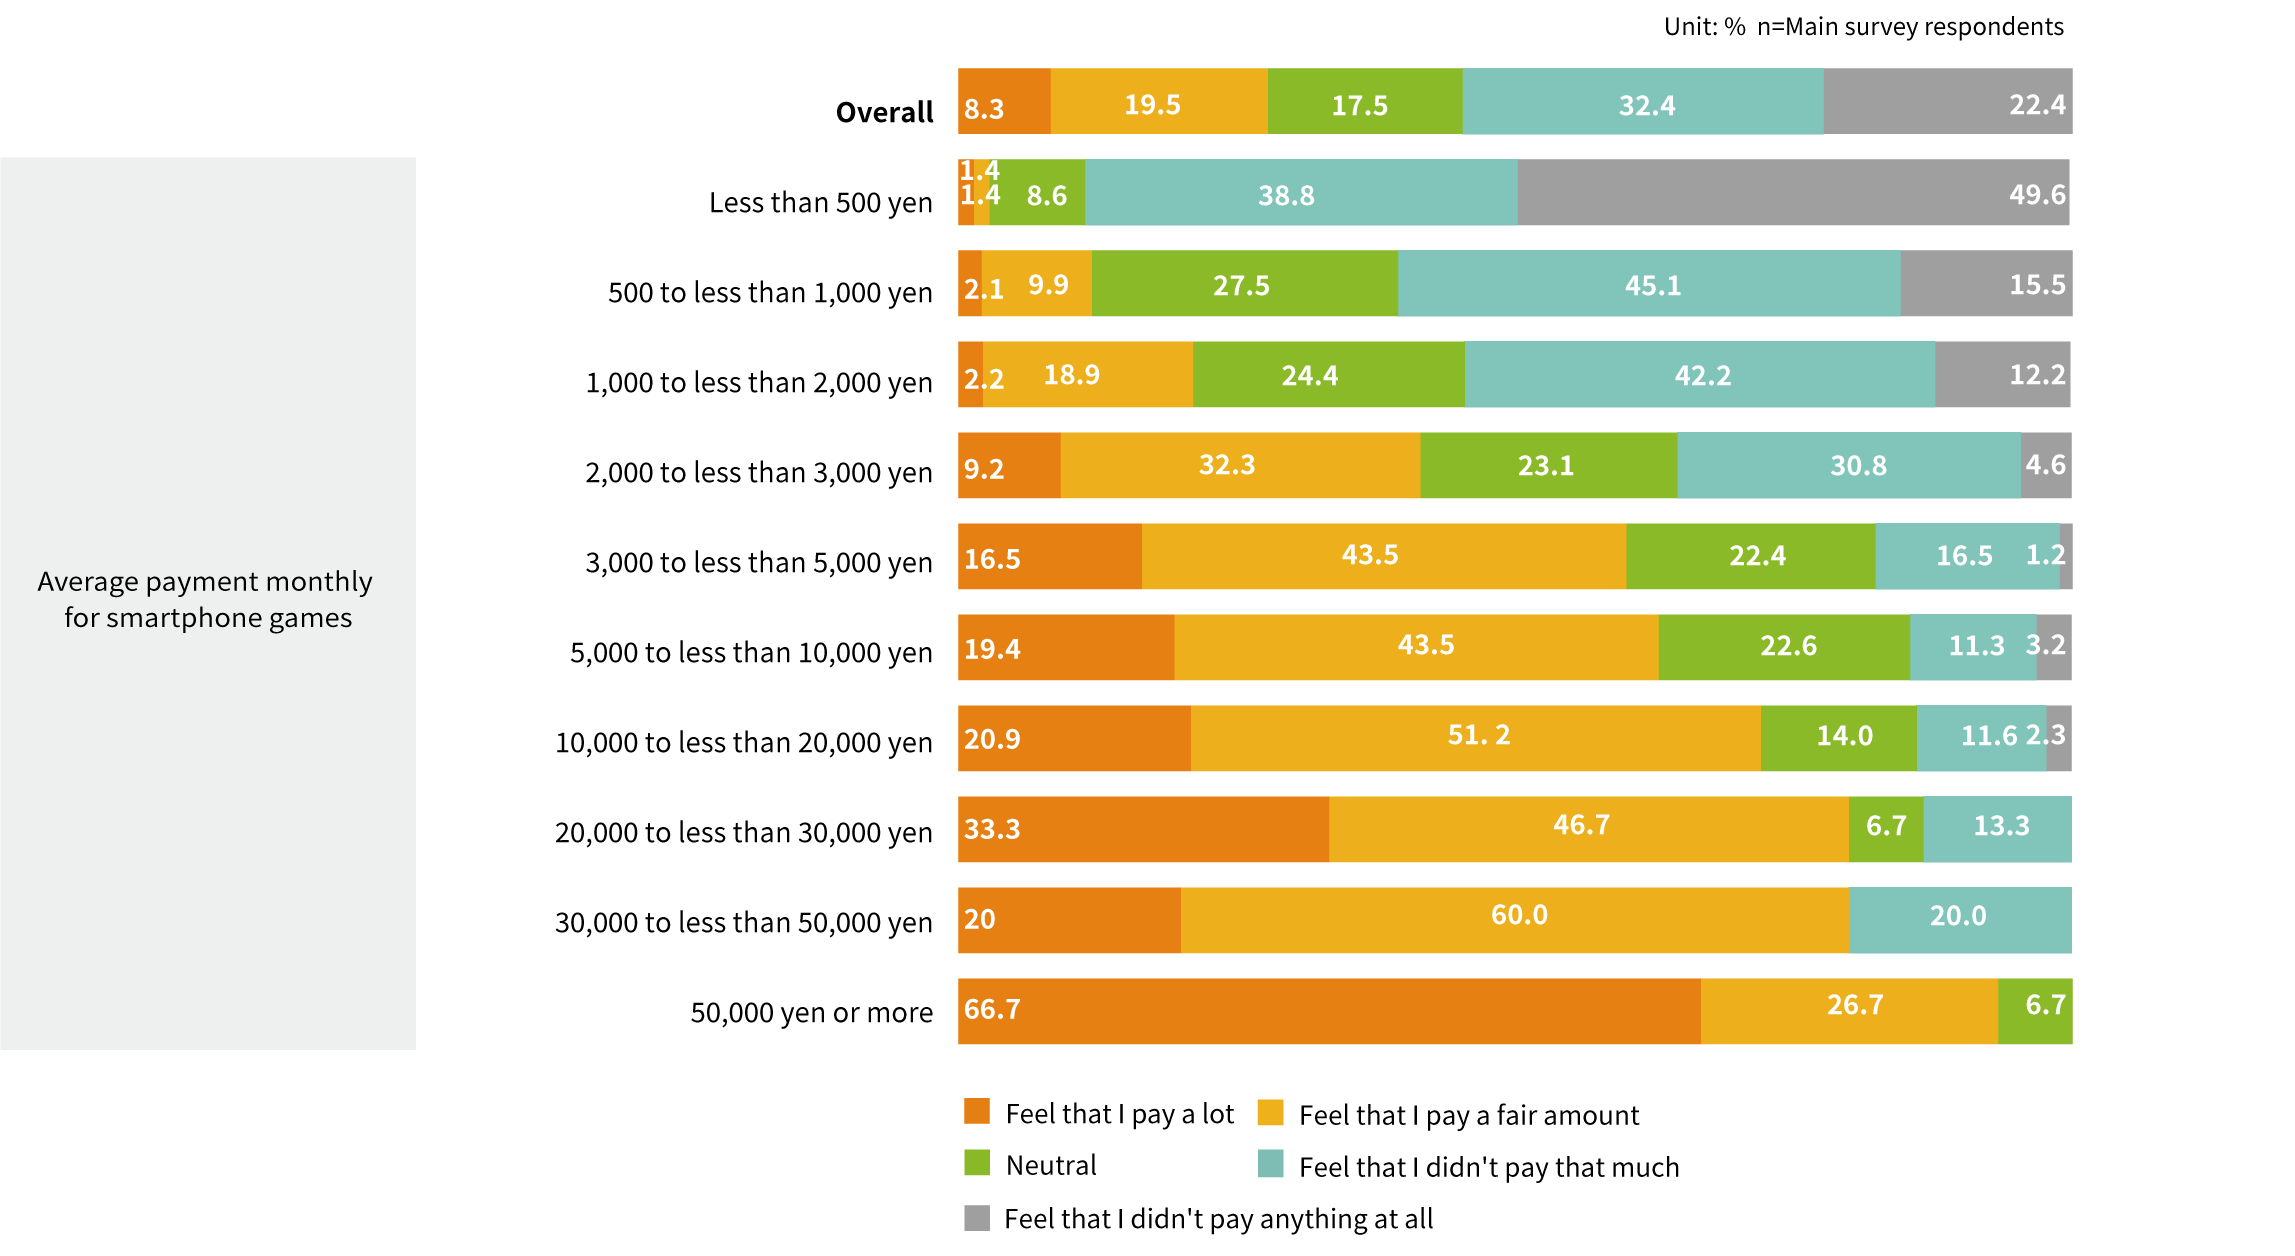
Do they have positive or negative feelings after payment?
Users paying less than 500 yen have a strong sense of feeling "pathetic" for their behavior, and have a negative impression overall.
However, those paying between 3,000 to 5,000 yen had the most positive impression.
*The figures for those paying 20,000 yen or more are for reference only due to the small sample size.
How they position themselves compared to other payment users
- Question
-
- Q4.How do you feel about the payment amounts compared to other users? Please tell us which one applies to you. (Select one only)
Is the amount of their payment big or small?
About 10% of users paying 10,000 yen or more a month think their payments are smaller than other users.
How busy they feel about playing smartphone games.
- Question
-
- Q5.Do you find yourself busy playing the smartphone games you pay for? (Select one only)
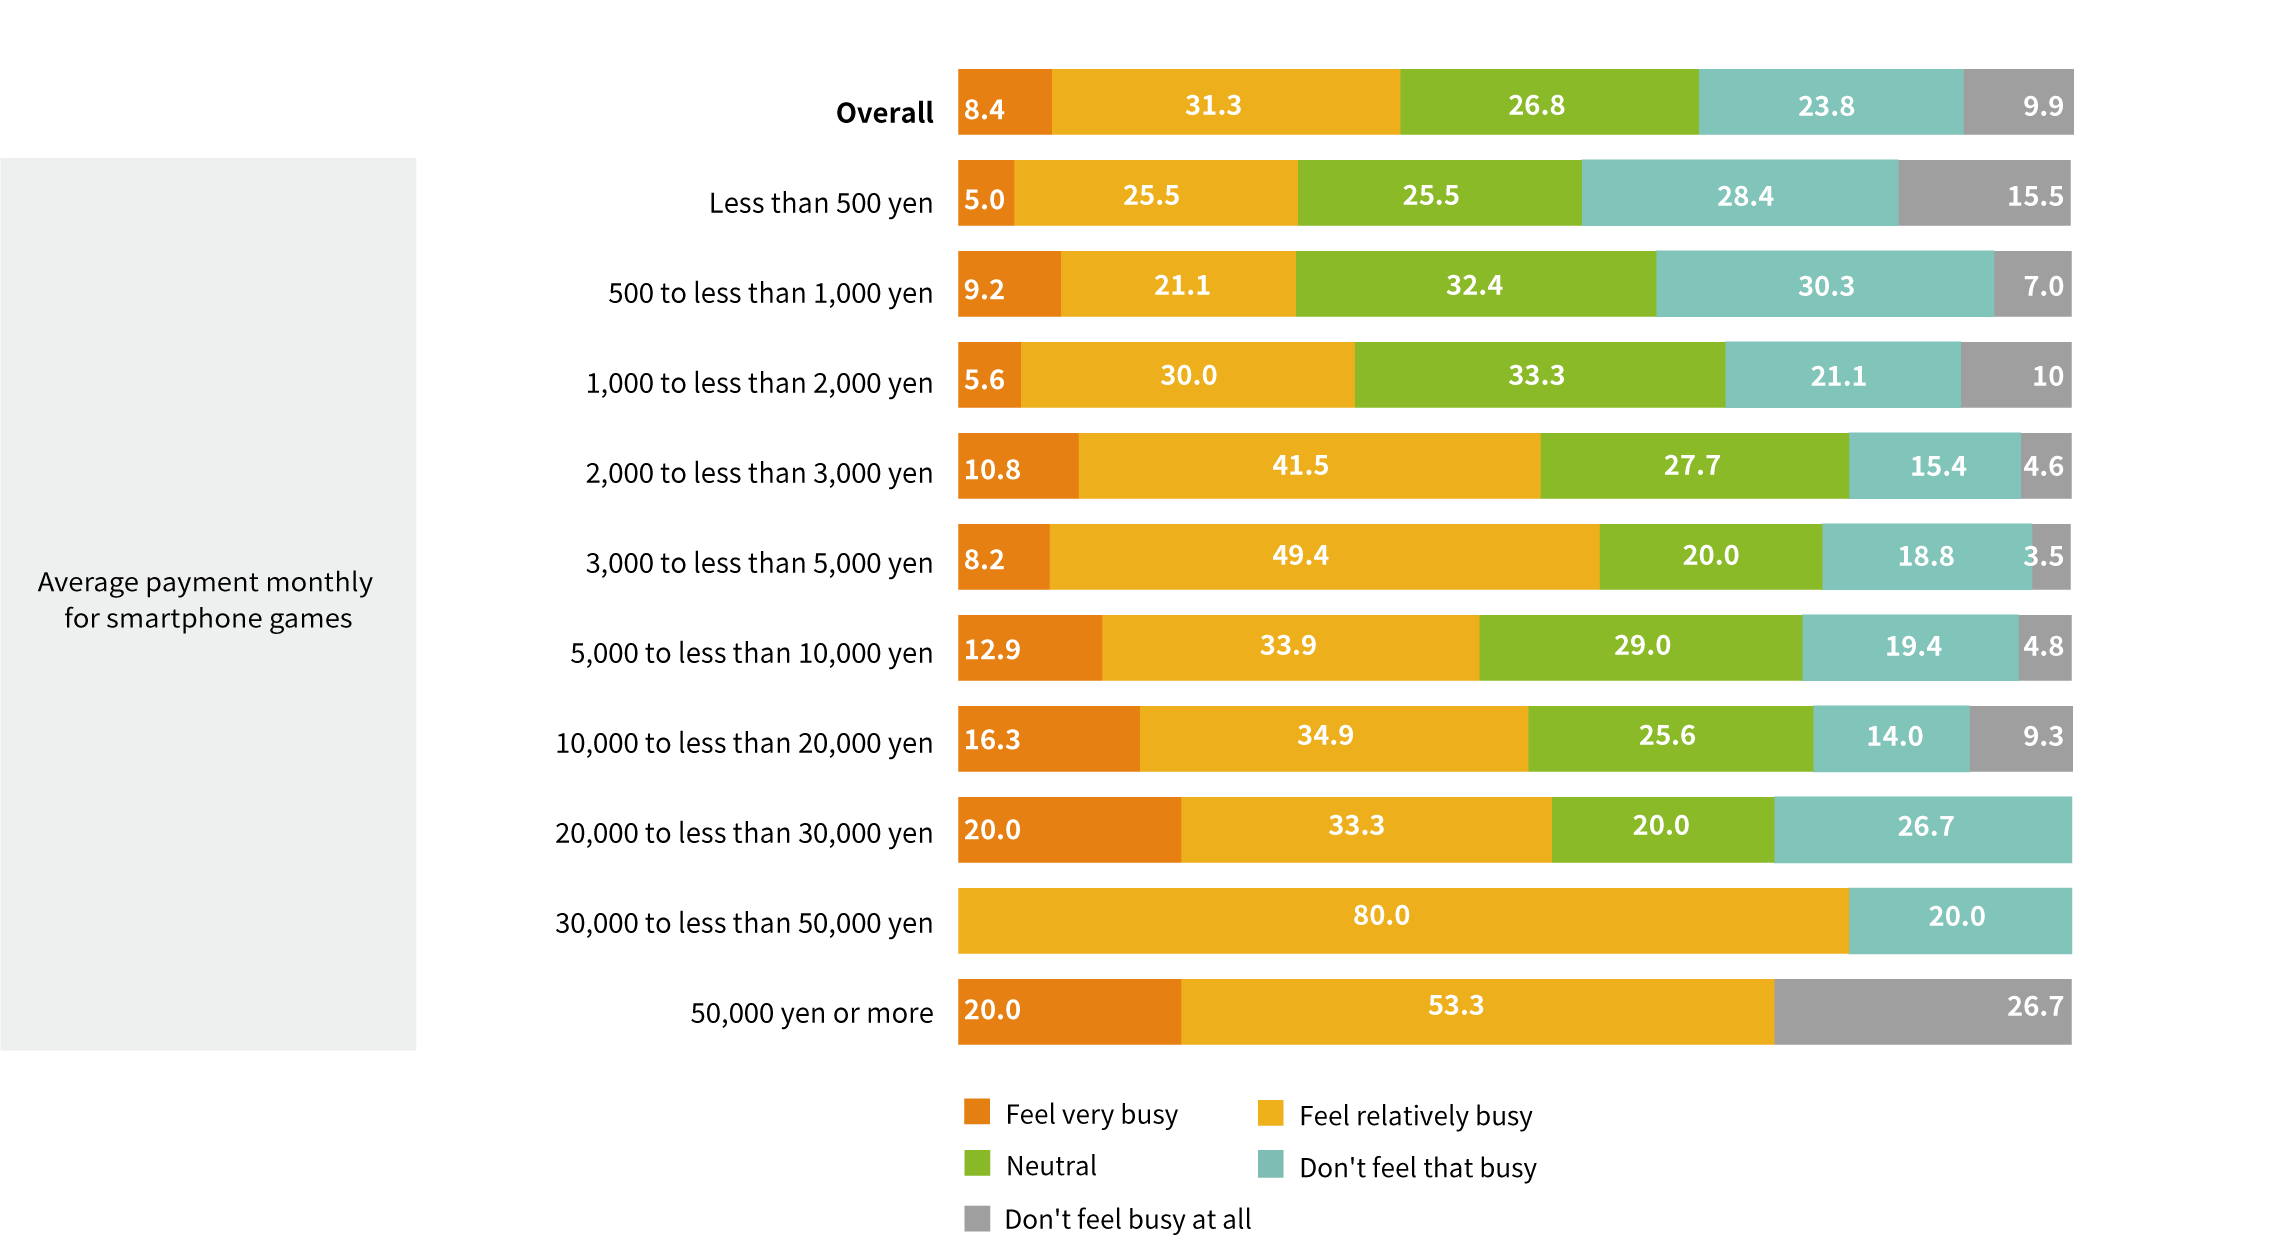
What percentage of users feel busy with the gameplay?
About 40% of the payers feel they are busy playing the game itself. This is clearly evident for users paying 2,000 yen or more a month.
Citing the research results
- ・The copyrights of this report belongs to ASMARQ.
- ・This report or any portion thereof may not be reproduced, quoted or used in any manner whatsoever without ASMARQ's explicit prior consent.
- ・Please notify ASMARQ when citing any of the copyrighted works.
- ・Any total or partial reproduction or representation of ASMARQ's published research material is strictly forbidden.
- ・Please inquire with us beforehand, when considering using ASMARQ's research material to advertise or promote one's product.
- ・ASMARQ can't be held reponsible for any direct or indirect harm or damage, including loss of profit, clientele or data or any other loss of intangible goods, loss of earnings or any other loss or harm which may result from use of ASMARQ's material
Contact: info@asmarq.co.jp
I would like to receive research data
It is possible to request for survey data, in case the requester couln't find the data one was
looking for. We are able to conduct research according to the requested criteria and questions.

In the previously released Survey on Hobbies (2021 Edition),
we found that the number of people playing games as a hobby has rapidly increased over the past seven years. This may be due to a dramatic change in lifestyles caused by COVID-19. Therefore, we focused on smartphone games and looked at the differences between those who have experienced paying for games and those who have not. What differences exist regarding average playing time and communication within the game? And how do the payers feel about paying for the game? This analysis is based on the average amount of payments per month.